Skeptometrics
Tax Rates and Inequality
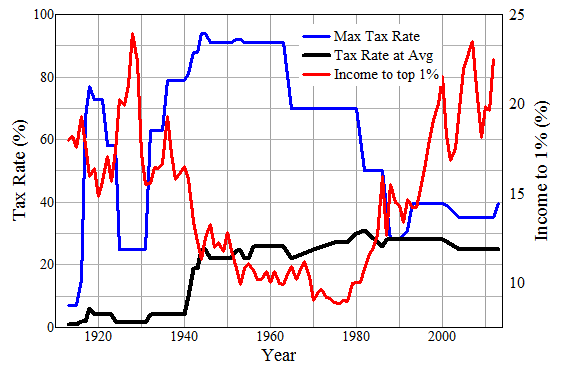
According to Piketty (Capital in the Twenty-First Century), inequality has been high through most of history except part of the 20th century. During the 20th century reduced inequality in the US corresponds closely with high marginal tax rates. Figure 1 shows the rate for the highest bracket (income tax only for a single individual), with the rate for average income, and the percentage of pre-tax income going to the top 1% (see below for sources of data). Other measures of inequality such as Gini coefficient are similar.
High marginal tax rates certainly did not inhibit GDP growth and low rates did not boost growth. Figure 2 shows the 5-year running average of annual real GDP growth rate
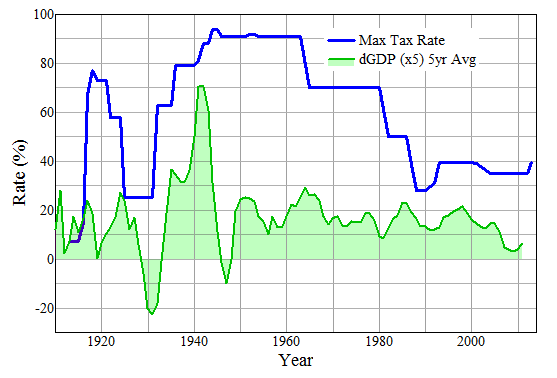
Although the 1920's are remembered as a period of prosperity, GDP growth was not exceptionally good. The 20's were "roaring" mostly for the highest-income individuals.
At the peak of WW II production in the 40's GDP was well above the long-term trend; the dip at the end of the war represents a return to trend level, not a major recession.
It is widely believed that cutting tax rates has a beneficial effect on private investment, but the data show no such effect. Private investment was reduced during the Presidential administrations in which cutting taxes was a major objective.
High marginal tax rates do not necessarily mean that large amounts of income are confiscated from high earners, or even from the population as a whole. Incomes may be adjusted so as not to come under the highest rates. In the US the rates on the average income obviously jumped up at the beginning of WW II and have never come down, but there is no reason to think that this level is onerous in itself. Economists tend to work under the simplistic assumption that socially useful investment and other activity is proportional to the magnitude of awards available, but the evidence does not support this. Real incentives are in general much more complex than assumed in typical economic dogmas.
For data on inequality see A Guide to Statistics on Historical Trends in Income Inequality , reference 17 for Piketty & Saez 2012 data on income fraction for top 1%. Tax rates from the Tax Foundation. The average income is average for full-time workers from the BLS.
3/17/2014