Real versus Phony Demographics
or: The Baby Boom Redux
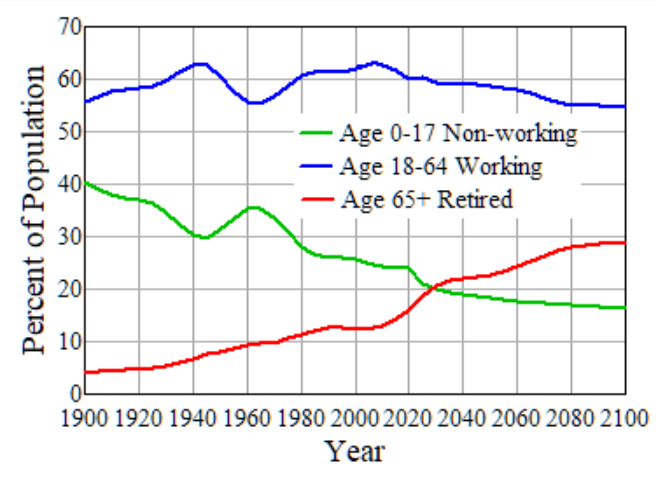
The fraction of people age 65 and older in the US population has been increasing since before the beginning of the 20th century because of a decline in birth rate. People who want to cut Social Security often say things like "In 1930 there were 11 people of working age for every person 65 and older, but by 2040 there will be fewer than 3 workers for every retired person." This looks very scary, and the numbers are approximately correct, but real demographics tell a different story. People of working age support those who are younger as well as older, and the figure below shows that while the fraction of older people (red line) has been increasing, the fraction of younger people (children - green line) has been decreasing. As a result, the fraction of people of working age in the population has remained fairly constant, between about 55% and 63% (blue curve). Near the end of the 21st century the fraction of working age will be about the same as it was in 1900 and again around 1965.
The baby boom, a surge in birth rate between about 1945 and 1973, did affect the ratios significantly, and the fraction of working-age was somewhat higher in the 1940's and again in the 2000's. Will the upcoming decline in working population as boomers retire be devastating to the country's economy? This is very unlikely, for one thing because it is really not that great in terms of the ratio of non-working to working people; and the country already survived the surge in non-working age when the baby boom passed through the non-working population for the first time as children. When this happened in the 60's economic growth was generally good.
Any small decrease in fraction of working people should be swamped by increases in productivity, as constantly explained by Dean Baker at the Beat the Press Blog.
Social Security is basically a non-funded, pay-as-you-go system - payroll taxes are collected and paid out immediately to retirees. The baby boom required some funding, which is most of the $2.7 billion in the SS Trust Fund. This should be paid out as boomers retire, and the system will be back to non-funded by about 2035. Post-boomers' retirement will not rely on the Trust Fund and it is nonsense to talk about "non-funded" obligations in Social Security - it is not really a funded system.
The nature of the expenses for those under working age and those over working age is different, and imposes different tax burdens. The expenses for children are borne directly by parents and through mostly local and state taxes for schools and higher education. The expenses for retired people are borne through their own savings and through federal payroll taxes for the Social Security system, and through both payroll and income taxes for Medicare. As the nature of the non-working population changes, so must the nature of taxation change; federal payroll and income taxes must increase, while direct parental expenses and local and other taxes for schools decrease. In fact the payroll tax rate for Social Security has increased since the beginning of the program and will have to increase more until population ratios stabilize. But this should be largely offset by decreasing tax expenses for schools and other expenses and services for children (welfare payments are mostly for children). Working people generally pay much more directly for their children, for food, lodging, entertainment and private or higher education, than they do for their parents or other elders for whom they may be directly responsible, so government taxes and expenditures do not tell the whole story.
Working-age people basically support both the young and the elderly. A rational approach to the change in demographics would consider quantitatively the expenses per person for those both younger and older than working age, and how these expenses are to be met by personal expenditures, state and local taxes, and federal taxes. This is almost never done. Framing things in terms of "generational war" is not helpful.
Beware of phony claims based on numbers such as the ratio of workers to retired - people who use such numbers are either ignorant of real demographics or are trying to fool others.
---------------------------------------------------------
Data are from the U.S. Census including their projections:
https://www2.census.gov/library/publications/2004/compendia/statab/123ed/hist/hs-03.pdf
https://www.census.gov/programs-surveys/popest/data/tables.html
https://www.census.gov/data/tables/2023/demo/popproj/2023-summary-tables.html
-------------------------------------------------------------
Updated 3/9/2024