Skeptometrics
Tax Cutting and Private Investment
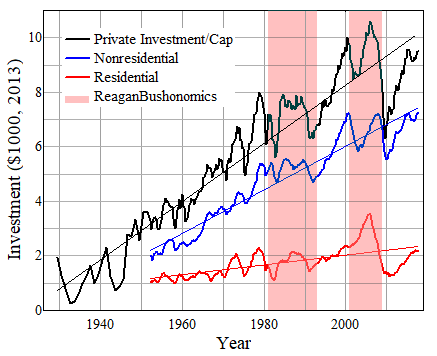
Private investment per capita has grown during all presidential administrations since the Depression - except Reagan-Bush I and Bush II, in which tax cuts and deregulation were dominant economic policies. These tax cuts were mainly for the upper brackets which are supposed to provide that investment. Conservative economic "theory" has it that reducing taxes and relaxing regulations should stimulate investment, but actual data on investment are completely incompatible with this.
In terms of total national investment in 2013 dollars, the maximum on this graph is about $3.1 trillion.
Specific major tax cuts, as in 1965, 1981 and 1986, have not produced immediate large increases in private investment, nor did the tax increase in 1993 cause a decrease. The recovery after the recession of 2001 was largely a matter of a bubble in housing, as shown clearly by the residential investment curve.
Recovery of private investment in the current cycle since the turnaround in early 2009 has been at least as good as in most previous cycles. Investment does not recover instantaneously and the hole reached during the downturn was a very deep one; comparing with a least-squares line through all the data, the total deficiency of private investment at the maximum in the last down-cycle was over $1 Trillion. The impediment to more rapid increase of investment is poor demand, certainly not high tax rates or excessive regulation. The current capital-gains and high-bracket income-tax rates are almost as low as they have ever been since the Depression, and regulations are looser than during many previous periods when investment expanded.
Job recovery in this cycle has been slower than in previous ones, among other reasons because of severe cutbacks in government jobs at the local level, an overall decrease in total real government spending 2010-2014, and the devastation of housing and construction. Despite a reasonable rate of recovery of investment it would take a record-length expansion period to bring per-capita investment back up to the peak level of 2005.
Data: http://research.stlouisfed.org/fred2/series/GPDI, also series GPDIA, PRFI and PNFI (and CPI and population data also from FRED). The actual data for residential and nonresidential investment add up to the total, but the least-squares lines do not do this exactly because they are calculated independently over a different period.
First posted 12/08; updated 10/17/09, 8/5/10, 4/24/12, 1/9/14, 1/28/18